
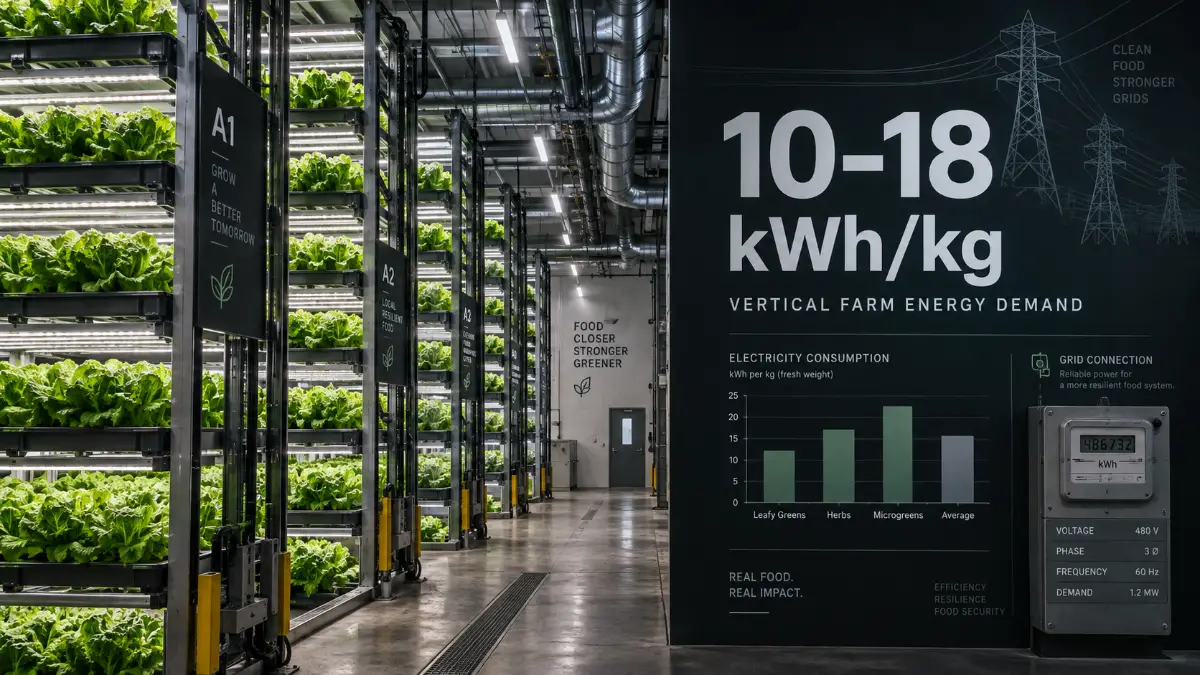
Commercial vertical farm operators rarely publish their electricity bills. They’ll talk about facility area, output, water savings, or number of growing layers, not kWh consumed per kilogram of produce. But that one ratio, specific electricity consumption (SEC), measured in kWh per kilogram of harvested crop, is the number that actually determines whether a facility is profitable, how it stacks up against competitors, and how exposed it is to grid regulation or rising power prices.
In this article7 sections
This guide walks through how to estimate that number for a real or planned facility, using nothing but published production figures and publicly available energy-intensity benchmarks, and how to compare the result against three real-world vertical farming facilities.

Three real-world farms as a benchmark
Since operators don’t publish energy bills, any estimate has to start from published production capacity and apply independently reported energy-intensity figures. Three facilities make a useful, size-spanning benchmark set:
- Bustanica, Dubai (UAE).
The facility covers 330,000 sq ft (approximately 30,658 m²) across three floors and is stated by its operator to have capacity to produce more than one million kilograms of crops a year. We use exactly 1,000,000 kg/year as a rounded capacity benchmark; this should not be interpreted as verified annual production. - Jones Food Company’s JFC2, Lydney (UK).
Designed for roughly 1,000 tonnes (1,000,000 kg) a year across 15 growing levels and about 13,750 to 15,000 m² of growing space. 2024 reporting suggested actual output was closer to 550 tonnes (550,000 kg) per year at the time. Jones Food Company entered administration on April 7, 2025 and ceased production, so the facility is modelled here purely at its historical design capacity as a scale benchmark. - Fischer Farms, Norwich (UK).
Roughly 25,000 m² of vertically stacked growing space, with a stated maximum output of 6.5 tonnes (6,500 kg) of leafy greens and herbs per day. Annualised (6,500 kg/day × 365 days), that’s 2,372,500 kg/year at full capacity: a ceiling, not necessarily the day-to-day norm.
| Facility | Publicly stated scale | Output used in the model |
|---|---|---|
| Bustanica | 330,000 sq ft (≈30,658 m²), 3 floors | 1,000,000 kg/year (rounded capacity basis) |
| JFC2 | ~13,750 to 15,000 m² growing area, 15 levels | 1,000,000 kg/year (historical design capacity) |
| Fischer Farms Norwich | 25,000 m² stacked growing space | 2,372,500 kg/year (maximum capacity) |
These area figures aren’t apples to apples. Bustanica’s 330,000 sq ft (≈30,658 m²) figure refers to total facility area; the other two figures refer specifically to growing area. That’s exactly why output, not floor space, is the more honest basis for an energy estimate.
What a kilogram of produce actually costs in electricity
Current vertical-farm energy intensity for lettuce sits at roughly 10 to 18 kWh per kilogram (kWh/kg), while a 2025 benchmarking study estimated a future technical benchmark of 3.1 to 7.4 kWh/kg as crop performance, equipment efficiency and operational control improve. These figures refer specifically to lettuce, so applying them to facilities producing mixed leafy greens and herbs should be treated as a benchmarking proxy rather than a measurement of actual consumption.
Company-reported data reviewed in a separate 2025 study points to a median efficiency of about 0.08 kg of fresh produce per kWh. Flip that around and you get 12.5 kWh/kg. We use that as a company-data median-derived reference. It is not the mathematical midpoint of the 10 to 18 kWh/kg range, which would be 14 kWh/kg. At the efficient end, a real large-scale commercial vertical farm has been reported at approximately 9.9 kWh/kg, close to the lower bound of the current benchmark range.
Worth keeping in mind: most of that energy never leaves the building as light. The overwhelming majority of it exits as heat, a cost center that, handled right, can become a second revenue stream.
See our breakdown of vertical farming’s waste-heat economics
Three standardised scenarios, applied consistently to any facility’s reported output, make for a fair comparison:
| Scenario | Specific electricity consumption (SEC) |
|---|---|
| Current lower benchmark | 10 kWh/kg |
| Company-data median-derived reference | 12.5 kWh/kg |
| Current upper benchmark | 18 kWh/kg |
The formulas
Annual electricity use is just annual output multiplied by energy intensity, divided by one million to convert kilowatt-hours (kWh) to gigawatt-hours (GWh):
E_annual (GWh/year) = (Q_annual [kg/year] × SEC [kWh/kg]) / 1,000,000where Q_annual is yearly output in kilograms per year (kg/year) and SEC is the specific electricity consumption in kilowatt-hours per kilogram (kWh/kg).
Annual energy consumption can also be translated into a continuous average electrical load, which is useful for thinking about grid connection size:
P_average (MW) = (E_annual [GWh/year] × 1,000) / 8,7608,760 is the number of hours in a standard 365-day year. For example, 10 GWh/year works out to roughly 1.14 MW of continuous average load; 18 GWh/year works out to roughly 2.05 MW. Actual peak demand typically runs higher than this average, especially when lighting, cooling and processing all spike at once.
You can also flip the question around and ask how much annual production would correspond to a given electricity-consumption threshold. This is useful if you’re checking exposure to a regulatory reporting or curtailment limit:
Q_threshold (kg/year) = Threshold [kWh/year] / SEC [kWh/kg]For context: Germany’s planned Sicherheitsplattform Strom registration framework covers electricity consumers using more than 8 GWh per withdrawal point in the previous calendar year.
Since 8 GWh equals 8,000,000 kWh, that threshold corresponds approximately to:
- 800,000 kg/year at 10 kWh/kg
- 640,000 kg/year at 12.5 kWh/kg
- 444,444 kg/year at 18 kWh/kg
Because the threshold is more than 8 GWh/year, actual registration would begin slightly above those production-equivalent values. Crossing that threshold does not itself mean a facility will be curtailed.
Read our full analysis of what that threshold means for vertical farm operators in Germany
Benchmark table: three farms, three scenarios
Running the formula above across all three facilities and all three SEC scenarios gives the following. Click a column header to sort.
| Facility | Annual Output (kg/year) | Est. Range Low (GWh/year) | Est. Range High (GWh/year) | Median-derived Est. (GWh/year) | Data Type |
|---|---|---|---|---|---|
| Bustanica | 1,000,000 | 10.0 | 18.0 | 12.5 | Capacity-based public-data estimate |
| JFC2 (historical design capacity) | 1,000,000 | 10.0 | 18.0 | 12.5 | Historical design-capacity estimate |
| Fischer Farms (max capacity) | 2,372,500 | 23.7 | 42.7 | 29.7 | Maximum-capacity public-data estimate |
All three rows are modelled estimates built from publicly reported capacity figures and the standardised 10–18 kWh/kg lettuce scenario range above, not electricity figures disclosed by the companies themselves. Bustanica is modelled using a rounded capacity basis, JFC2 using historical design capacity, and Fischer Farms using maximum stated capacity. See the methodology note below. If you operate one of these facilities, or any vertical farm, and can share an actual measured SEC figure, we’ll gladly add it as a separately labelled “company-reported” entry; see the correction note at the end of this article.
Calculate your own farm’s energy demand
Use the calculator below to plug in your own annual output and either your known energy intensity or your actual electricity consumption, and see how you compare against the three benchmark facilities above.
Vertical Farm Energy Demand Calculator
Estimate your farm's annual electricity demand and specific electricity consumption (kWh/kg), then compare the result with current lettuce energy benchmarks and commercial-scale reference facilities.
Annual output is required in both calculation modes so electricity use can be converted to kWh per kilogram.
Not sure? Current lettuce benchmarks are approximately 10–18 kWh/kg. A 12.5 kWh/kg reference value is derived from the median of published company-reported data.
Example: a facility using 5,300 MWh per year should enter 5300 and select MWh.
Your result
The current 10–18 kWh/kg range is a published benchmark for lettuce production. Crop type, lighting strategy, climate, facility design and operating conditions can materially change actual energy use.
Reference facilities are modelled using the same 12.5 kWh/kg company-data median-derived SEC. This comparison illustrates facility scale, not measured energy efficiency.
Bustanica is shown using a rounded 1,000,000 kg/year capacity basis. JFC2 is shown using its historical 1,000,000 kg/year design capacity; its operator entered administration in 2025 and production ceased. Fischer Farms is shown using its stated maximum capacity of 2,372,500 kg/year. These are modelled reference values, not company-disclosed electricity consumption.
A note on the numbers
The estimates in the table above are not claims about what Bustanica, JFC2 or Fischer Farms actually consume. They are standardised scenarios applied consistently to each facility’s selected output basis, so the comparison is fair, but they are estimates, not disclosed figures.
A few limitations worth being upfront about:
- The 10–18 kWh/kg benchmark refers specifically to lettuce. Applying it to mixed leafy greens and herbs is a benchmarking proxy.
- The 12.5 kWh/kg reference is derived from a reported median of 0.08 kg/kWh across six company-declared data points. It is not the mathematical midpoint of the 10–18 kWh/kg range.
- Bustanica is modelled using a rounded 1,000,000 kg/year capacity basis, not verified annual production. Its reported facility area of 330,000 sq ft is approximately 30,658 m².
- JFC2 is shown at historical design capacity. Jones Food Company entered administration in April 2025 and production ceased.
- Fischer Farms is shown at maximum stated capacity, not necessarily current annual throughput.
- None of the underlying electricity figures are self-reported by the three operators. If that changes, this table is the first place we’ll update, and we’ll keep the two data types (public-data estimate vs. company-reported) clearly separated rather than blending them.
Spotted a figure that looks wrong, or can you point us to an actual disclosed SEC value for one of these facilities?
Get in touch and we’ll review it.
Further Reading
- Germany Could Legally Force Vertical Farming to Go Dark. Here’s What That Means for Investors
- Vertical Farming’s Waste-Heat Economics: Turning a Cost Center Into Revenue
- The Real Startup Cost of a Vertical Farm
- Top 10 Vertical Farming Companies 2026
Sources8 references
- Bustanica facility size and production capacity:
Emirates Flight Catering, February 2024 - JFC2 design capacity, growing area and 15 growing levels:
Carrier case study - JFC2 reported 2024 production of roughly 550 tonnes/year:
The Guardian, March 2024 - Jones Food Company administration from April 7, 2025:
UK Companies House - Fischer Farms Norwich growing area and 6.5 tonnes/day maximum capacity:
Fischer Farms - 10–18 kWh/kg current lettuce benchmark, 3.1–7.4 kWh/kg technical benchmark and approximately 9.9 kWh/kg commercial reference:
Miserocchi & Franco (2025),
Benchmarking energy efficiency in vertical farming: Status and prospects - 0.08 kg/kWh median company-reported energy-use efficiency:
Pennisi et al. (2025),
Vertical farming: productivity, environmental impact, and resource use. A review - Planned >8 GWh/year registration threshold, Sicherheitsplattform Strom:
Bundesnetzagentur